How to find midpoint Riemann sums - AP Calculus AB
Card 0 of 2618
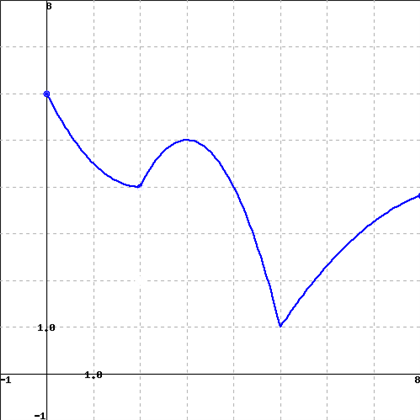
Approximate the area under the curve from  using the midpoint Riemann Sum with a partition of size five given the graph of the function.
Approximate the area under the curve from
We begin by finding the given change in x:

We then define our partition intervals:
,[1.6,3.2),[3.2,4.8),[4.8,6.4),[6.4,8]")
We then choose the midpoint in each interval:

Then we find the value of the function at the point. This is determined through observation of the graph
\approx 4.8,4.5,4,1.6,3.4")
Then we simply substitute these values into the formula for the Riemann Sum
\Delta x=4.8\cdot 1.6+4.5\cdot 1.6+4\cdot 1.6+1.6\cdot 1.6+3.4\cdot 1.6\ =1.6(4.8+4.5+4+1.6+3.4)=1.6\cdot 18.3=29.28")
We begin by finding the given change in x:
We then define our partition intervals:
We then choose the midpoint in each interval:
Then we find the value of the function at the point. This is determined through observation of the graph
Then we simply substitute these values into the formula for the Riemann Sum
Compare your answer with the correct one above
Calculate the area between  ,
,  ,
, =x^3+3x+1") , and the x-axis using Riemann Midpoint sums.
, and the x-axis using Riemann Midpoint sums.
Calculate the area between
Riemann Sums are a way to approximate the area under a curve. While taking an integral gives you an exact area, using Riemann Sums is a way to get a fast estimation given a function that might be more difficult to integrate. There are many different ways to use this technique. Given some number, n (which as it increases gives you better approximations), we can split the area under the curve into n rectangles. The height of each rectangle depends on what version of Riemann Sums you are using. Three such versions are left endpoint, right endpoint, and midpoint. The formula itself is simple, say we have a curve bounded in \[a,b\]. Then we can approximate the area using the following equation
= \Delta x\left(\sum_{k=1}^n f(x_n)\right )") .
.
Where the  are a list of midpoints for each rectangle and
  which is the width of each rectangle.
First we calculate the length of each subinterval
 .
.
Now we look at the first rectangle.
It is in between 5 and 7 so the midpoint of the two is 6.
Now we easily know the midpoint of all 5 of the rectangles
 .
.
Thus the area is thus
+f(8)+f(10)+f(12)+f(14))")
=6^3+3(6)+1=235")
=8^3+3(8)+1=537")
=10^3+3(10)+1=1031")
=12^3+3(12)+1=1765")
=14^3+3(14)+1=2787")
which is simply
=12710") .
.
Riemann Sums are a way to approximate the area under a curve. While taking an integral gives you an exact area, using Riemann Sums is a way to get a fast estimation given a function that might be more difficult to integrate. There are many different ways to use this technique. Given some number, n (which as it increases gives you better approximations), we can split the area under the curve into n rectangles. The height of each rectangle depends on what version of Riemann Sums you are using. Three such versions are left endpoint, right endpoint, and midpoint. The formula itself is simple, say we have a curve bounded in \[a,b\]. Then we can approximate the area using the following equation
Where the
First we calculate the length of each subinterval
Now we look at the first rectangle.
It is in between 5 and 7 so the midpoint of the two is 6.
Now we easily know the midpoint of all 5 of the rectangles
Thus the area is thus
which is simply
Compare your answer with the correct one above
Approximate the area under the curve from using the midpoint Riemann Sum with a partition of size five given the graph of the function.
Approximate the area under the curve from
We begin by finding the given change in x:
We then define our partition intervals:
We then choose the midpoint in each interval:
Then we find the value of the function at the point. This is determined through observation of the graph
Then we simply substitute these values into the formula for the Riemann Sum
Compare your answer with the correct one above
Calculate the area between , , , and the x-axis using Riemann Midpoint sums.
Calculate the area between
Riemann Sums are a way to approximate the area under a curve. While taking an integral gives you an exact area, using Riemann Sums is a way to get a fast estimation given a function that might be more difficult to integrate. There are many different ways to use this technique. Given some number, n (which as it increases gives you better approximations), we can split the area under the curve into n rectangles. The height of each rectangle depends on what version of Riemann Sums you are using. Three such versions are left endpoint, right endpoint, and midpoint. The formula itself is simple, say we have a curve bounded in \[a,b\]. Then we can approximate the area using the following equation
.
Where the are a list of midpoints for each rectangle and which is the width of each rectangle.
First we calculate the length of each subinterval
.
Now we look at the first rectangle.
It is in between 5 and 7 so the midpoint of the two is 6.
Now we easily know the midpoint of all 5 of the rectangles
.
Thus the area is thus
which is simply
.
Riemann Sums are a way to approximate the area under a curve. While taking an integral gives you an exact area, using Riemann Sums is a way to get a fast estimation given a function that might be more difficult to integrate. There are many different ways to use this technique. Given some number, n (which as it increases gives you better approximations), we can split the area under the curve into n rectangles. The height of each rectangle depends on what version of Riemann Sums you are using. Three such versions are left endpoint, right endpoint, and midpoint. The formula itself is simple, say we have a curve bounded in \[a,b\]. Then we can approximate the area using the following equation
Where the
First we calculate the length of each subinterval
Now we look at the first rectangle.
It is in between 5 and 7 so the midpoint of the two is 6.
Now we easily know the midpoint of all 5 of the rectangles
Thus the area is thus
which is simply
Compare your answer with the correct one above