Charts

1st Grade Math · Learn by Concept

Help Questions

1st Grade Math › Charts

1 - 2
1

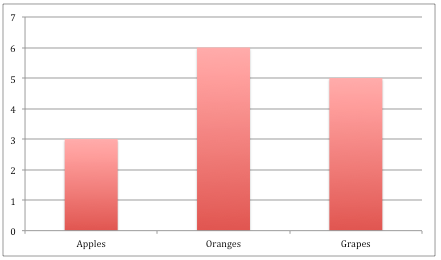
Look at the chart below. How many more grapes are there than apples?

Screen shot 2015 09 18 at 11.59.56 am

CORRECT

0

0

0

Explanation

Looking at the chart, the bar shown for grapes goes up to the number and the bar shown for apples goes up to . The phrase "how many more" means that we are going to subtract to find the difference between the grapes and apples.

2

Look at the chart below. If we add more oranges, how many oranges will we have?

Screen shot 2015 09 18 at 11.59.56 am

CORRECT

0

0

0

Explanation

If we look at the graph, the bar shown for oranges goes up to . This means that we currently have oranges. If we are going to add more oranges, we can add and to find our answer.