
Functions, Graphs, and Limits - AP Calculus BC
Card 1 of 1344
Find the vector form of  to
to  .
.
Find the vector form of
Tap to reveal answer
When we are trying to find the vector form we need to remember the formula which states to take the difference between the ending and starting point.
Thus we would get:
Given  and
and 

In our case we have ending point at  and our starting point at
  .
.
Therefore we would set up the following and simplify.

When we are trying to find the vector form we need to remember the formula which states to take the difference between the ending and starting point.
Thus we would get:
Given
In our case we have ending point at
Therefore we would set up the following and simplify.
← Didn't Know|Knew It →

Tap to reveal answer
In general:
If  ,
,
then 
Derivative rules that will be needed here:
- Taking a derivative on a term, or using the power rule, can be done by doing the following:

- Special rule when differentiating an exponential function:
 , where k is a constant.
In this problem, 


Put it all together to get 

In general:
If
then
Derivative rules that will be needed here:
- Taking a derivative on a term, or using the power rule, can be done by doing the following:
- Special rule when differentiating an exponential function:
In this problem,
Put it all together to get
← Didn't Know|Knew It →

Calculate 
Calculate
Tap to reveal answer
Calculate the sum of vectors.
In general,


Solution:


Calculate the sum of vectors.
In general,
Solution:
← Didn't Know|Knew It →
Given points  and
and  , what is the vector form of the distance between the points?
Given points
Tap to reveal answer
In order to derive the vector form of the distance between two points, we must find the difference between the  ,
,  , and
, and  elements of the points.
That is, for any point
 and
and  ,
,
the distance is the vector
 .
.
Subbing in our original points  and
and  , we get:


In order to derive the vector form of the distance between two points, we must find the difference between the
That is, for any point
the distance is the vector
Subbing in our original points
← Didn't Know|Knew It →
Given points  and
and  , what is the vector form of the distance between the points?
Given points
Tap to reveal answer
In order to derive the vector form of the distance between two points, we must find the difference between the , , and elements of the points.
That is, for any point and , the distance is the vector .
Subbing in our original points  and
and  , we get:


In order to derive the vector form of the distance between two points, we must find the difference between the
That is, for any point
Subbing in our original points
← Didn't Know|Knew It →
The graph of the vector function 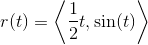 can also be represented by the graph of which of the following functions in rectangular form?
The graph of the vector function
Tap to reveal answer
We can find the graph of 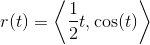 in rectangular form by mapping the parametric coordinates to Cartesian coordinates
  :
:


We can now use this value to solve for  :
:


We can find the graph of
We can now use this value to solve for
← Didn't Know|Knew It →
The graph of the vector function  can also be represented by the graph of which of the following functions in rectangular form?
The graph of the vector function
Tap to reveal answer
We can find the graph of  in rectangular form by mapping the parametric coordinates to Cartesian coordinates :


We can now use this value to solve for :
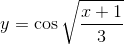
We can find the graph of
We can now use this value to solve for
← Didn't Know|Knew It →
Write in Cartesian form:

Write in Cartesian form:
Tap to reveal answer
 , so
, so
 .
.
 , so
, so


← Didn't Know|Knew It →
Write in Cartesian form:


Write in Cartesian form:
Tap to reveal answer
 ,
,
so the Cartesian equation is
 .
.
so the Cartesian equation is
← Didn't Know|Knew It →
Rewrite as a Cartesian equation:

Rewrite as a Cartesian equation:
Tap to reveal answer


So
 or
or 
We are restricting  to values on
  , so
, so  is nonnegative; we choose
 .
.
Also,


So
 or
or 
We are restricting  to values on
  , so
, so  is nonpositive; we choose

or equivalently,

to make  nonpositive.
Then,

and


So
We are restricting
Also,
So
We are restricting
or equivalently,
to make
Then,
and
← Didn't Know|Knew It →
Write in Cartesian form:


Write in Cartesian form:
Tap to reveal answer

so


Therefore the Cartesian equation is  .
.
so
Therefore the Cartesian equation is
← Didn't Know|Knew It →
Write in Cartesian form:

Write in Cartesian form:
Tap to reveal answer
Rewrite  using the double-angle formula:

Then


which is the correct choice.
Rewrite
Then
which is the correct choice.
← Didn't Know|Knew It →
Rewrite as a Cartesian equation:

Rewrite as a Cartesian equation:
Tap to reveal answer

 , so
, so

This makes the Cartesian equation
 .
.
This makes the Cartesian equation
← Didn't Know|Knew It →
 and
and  . What is
  in terms of
  (rectangular form)?
Tap to reveal answer
In order to solve this, we must isolate  in both equations.
 and
and
 .
.
Now we can set the right side of those two equations equal to each other since they both equal  .
.
 .
.
By multiplying both sides by  , we get
  , which is our equation in rectangular form.
In order to solve this, we must isolate
Now we can set the right side of those two equations equal to each other since they both equal
By multiplying both sides by
← Didn't Know|Knew It →
If  and
and  , what is
  in terms of
  (rectangular form)?
If
Tap to reveal answer
Given  and
and  , we can find
  in terms of
  by isolating
  in both equations:


Since both of these transformations equal  , we can set them equal to each other:


Given
Since both of these transformations equal
← Didn't Know|Knew It →
If  and
and  , what is in terms of (rectangular form)?
If
Tap to reveal answer
Given  and
and  , we can find in terms of by isolating in both equations:


Since both of these transformations equal , we can set them equal to each other:


Given
Since both of these transformations equal
← Didn't Know|Knew It →
If  and
and  , what is in terms of (rectangular form)?
If
Tap to reveal answer
Given  and
and  , we can find in terms of by isolating in both equations:


Since both of these transformations equal , we can set them equal to each other:


Given
Since both of these transformations equal
← Didn't Know|Knew It →
Given  and
and  , what is
  in terms of
  (rectangular form)?
Given
Tap to reveal answer
In order to find  with respect to
  , we first isolate
  in both equations:

Since both equations equal  , we can then set them equal to each other and solve for
  :
:


In order to find
Since both equations equal
← Didn't Know|Knew It →
Given  and
and  , what is
  in terms of
  (rectangular form)?
Given
Tap to reveal answer
In order to find  with respect to
  , we first isolate
  in both equations:

Since both equations equal  , we can then set them equal to each other and solve for
  :
:


In order to find
Since both equations equal
← Didn't Know|Knew It →
Given  and
and  , what is in terms of (rectangular form)?
Given
Tap to reveal answer
In order to find with respect to , we first isolate in both equations:


Since both equations equal , we can then set them equal to each other and solve for :


In order to find
Since both equations equal
← Didn't Know|Knew It →