Data Analysis and Probability - ISEE Lower Level: Quantitative Reasoning
Card 1 of 16
Look at the chart below. If we add  more apples, how many more apples will we have?
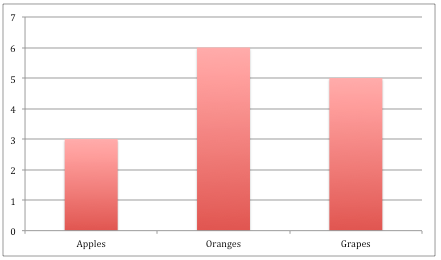
Look at the chart below. If we add
Tap to reveal answer
Looking at the graph, we first need to figure out how many apples we are starting with. We are starting with  apples and we are going to add
  more apples, which means we will have
  apples.

Looking at the graph, we first need to figure out how many apples we are starting with. We are starting with
← Didn't Know|Knew It →
Look at the chart below. How many grapes are there?
Look at the chart below. How many grapes are there?
Tap to reveal answer
In the chart, grapes are shown in the last bar, on the right. That bar goes up to the number  , which means there are
  grapes.
In the chart, grapes are shown in the last bar, on the right. That bar goes up to the number
← Didn't Know|Knew It →
Kate's class is going to plant flowers outside of their class window. To help decide what flower to plant, her teacher took a class vote.
Use the graph below to help answer the question.
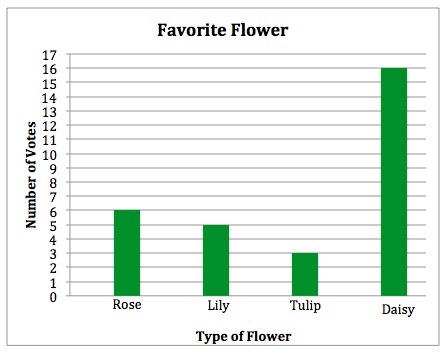
What is the label of the x-axis?
Kate's class is going to plant flowers outside of their class window. To help decide what flower to plant, her teacher took a class vote.
Use the graph below to help answer the question.
What is the label of the x-axis?
Tap to reveal answer
A graph is made up of an x-axis and a y-axis. The x-axis of a graph is always the horizontal line (a line that runs from left to right) and the y-axis is alway the vertical line (a line that runs from top to bottom)
The x-axis of this graph is labeled "Type of Flower".
A graph is made up of an x-axis and a y-axis. The x-axis of a graph is always the horizontal line (a line that runs from left to right) and the y-axis is alway the vertical line (a line that runs from top to bottom)
The x-axis of this graph is labeled "Type of Flower".
← Didn't Know|Knew It →
Mrs. Ryan's class had their class election today for their class president. The results are displayed in the chart below.
Use the graph below to help answer the question.
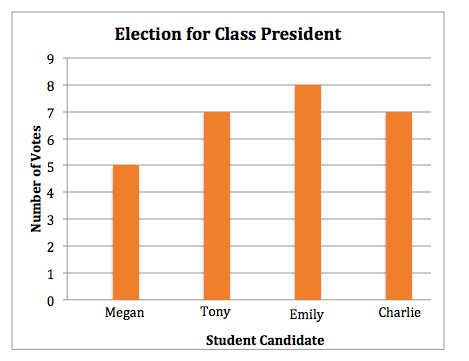
How many people voted for Megan?
Mrs. Ryan's class had their class election today for their class president. The results are displayed in the chart below.
Use the graph below to help answer the question.
How many people voted for Megan?
Tap to reveal answer
The bar for Megan is the first bar on the left. The bar raises to the number  , which means
  people voted for Megan.
The bar for Megan is the first bar on the left. The bar raises to the number
← Didn't Know|Knew It →
Look at the chart below. If we add more apples, how many more apples will we have?
Look at the chart below. If we add
Tap to reveal answer
Looking at the graph, we first need to figure out how many apples we are starting with. We are starting with apples and we are going to add more apples, which means we will have apples.
Looking at the graph, we first need to figure out how many apples we are starting with. We are starting with
← Didn't Know|Knew It →
Look at the chart below. How many grapes are there?
Look at the chart below. How many grapes are there?
Tap to reveal answer
In the chart, grapes are shown in the last bar, on the right. That bar goes up to the number , which means there are grapes.
In the chart, grapes are shown in the last bar, on the right. That bar goes up to the number
← Didn't Know|Knew It →
Kate's class is going to plant flowers outside of their class window. To help decide what flower to plant, her teacher took a class vote.
Use the graph below to help answer the question.
What is the label of the x-axis?
Kate's class is going to plant flowers outside of their class window. To help decide what flower to plant, her teacher took a class vote.
Use the graph below to help answer the question.
What is the label of the x-axis?
Tap to reveal answer
A graph is made up of an x-axis and a y-axis. The x-axis of a graph is always the horizontal line (a line that runs from left to right) and the y-axis is alway the vertical line (a line that runs from top to bottom)
The x-axis of this graph is labeled "Type of Flower".
A graph is made up of an x-axis and a y-axis. The x-axis of a graph is always the horizontal line (a line that runs from left to right) and the y-axis is alway the vertical line (a line that runs from top to bottom)
The x-axis of this graph is labeled "Type of Flower".
← Didn't Know|Knew It →
Mrs. Ryan's class had their class election today for their class president. The results are displayed in the chart below.
Use the graph below to help answer the question.
How many people voted for Megan?
Mrs. Ryan's class had their class election today for their class president. The results are displayed in the chart below.
Use the graph below to help answer the question.
How many people voted for Megan?
Tap to reveal answer
The bar for Megan is the first bar on the left. The bar raises to the number , which means people voted for Megan.
The bar for Megan is the first bar on the left. The bar raises to the number
← Didn't Know|Knew It →