Standard Deviation
SAT Math · Learn by Concept
Help Questions
SAT Math › Standard Deviation
1 - 1
1
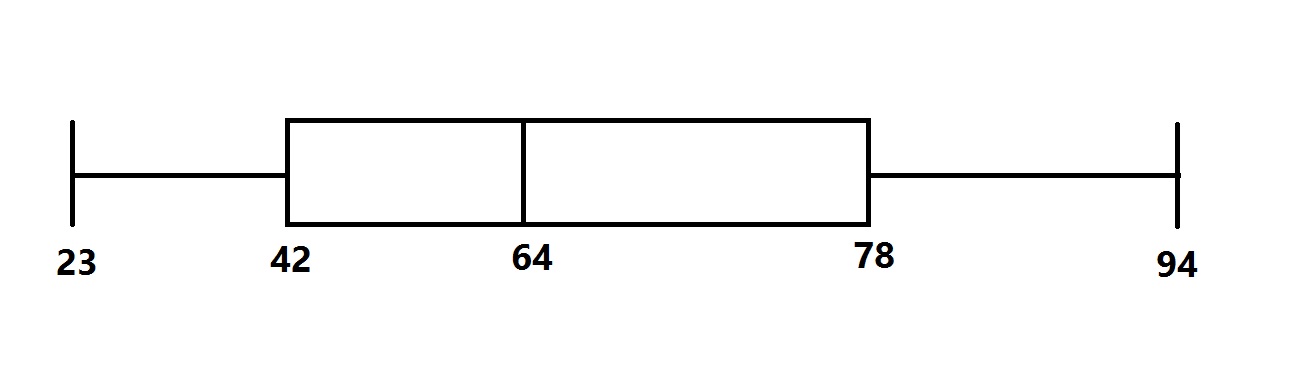
The distribution of scores for a test given to a large group of students is represented by the above box-and-whisker plot.
To the nearest whole number, what was the standard deviation of the scores?
Insufficient information is given to answer the question.
CORRECT


Explanation
A box-and-whisker plot gives the lowest and highest scores and the three quartiles (including the median), which depend on the relative position of the scores. The standard deviation of the scores depends on the scores themselves, which are not reflected in the diagram. The question cannot be answered from the box-and-whisker plot.