How to use a Venn Diagram - SSAT Middle Level: Quantitative
Card 1 of 64

See the above Venn diagram. Which of the following sets is represented by the gray region?
See the above Venn diagram. Which of the following sets is represented by the gray region?
Tap to reveal answer
The gray region represents all elements that either are in  , are not in
  - that is, are in
  - or both. This is the union of
  and
and  , or
, or  .
.
The gray region represents all elements that either are in
← Didn't Know|Knew It →
See the above Venn diagram. Which of the following sets is represented by the gray region?
See the above Venn diagram. Which of the following sets is represented by the gray region?
Tap to reveal answer
The shaded area represents the set of all elements that are both in  and not in
  . This the intersection of
  and the complement of
  , or
, or  .
.
The shaded area represents the set of all elements that are both in
← Didn't Know|Knew It →

Let set  , the set of all natural numbers.
 = {
= { |
|  is a multiple of 6 }
 = {
= { |
|  is a multiple of 9 }
Which of the following numbers would appear in the gray region of the Venn diagram?
Let set
Which of the following numbers would appear in the gray region of the Venn diagram?
Tap to reveal answer
The gray area represents the portion of  that is not in
  - in other words, all multiples of 9 that are not also multiples of 6.


Therefore, 4,572, 3,438, and 8,544 can be eliminated.
 , so 9,349 can be eliminated because it isn't a multiple of 9.
 and
and  , so, as both a nonmultiple of 6 and a multiple of 9, 4.077 is the correct choice.
The gray area represents the portion of
Therefore, 4,572, 3,438, and 8,544 can be eliminated.
← Didn't Know|Knew It →
Given the Venn diagram below, which of the following does not belong to  ?
?
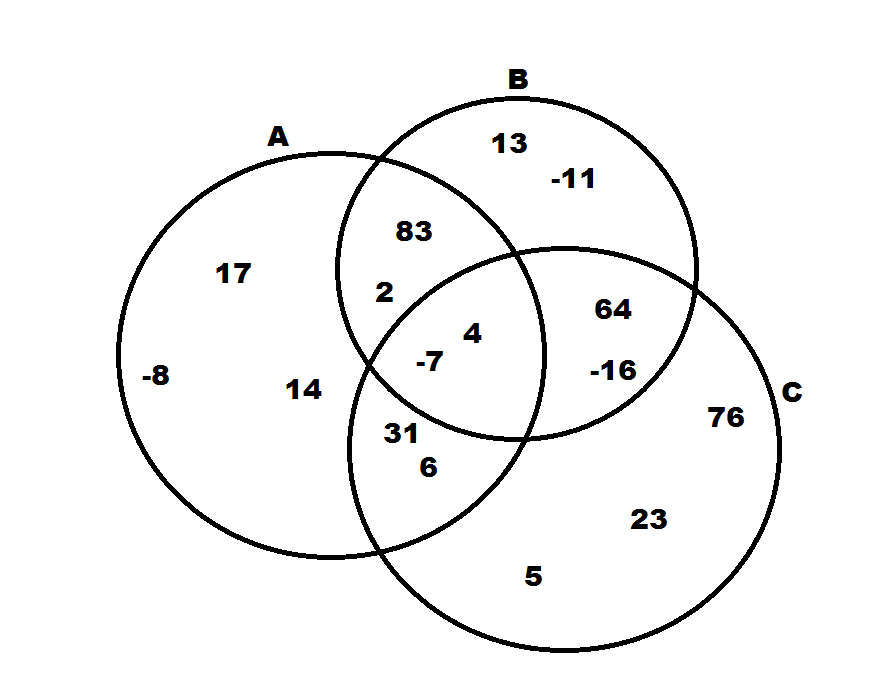
Given the Venn diagram below, which of the following does not belong to
Tap to reveal answer
The symbol  stands for the union between two sets. Therefore,
  means the set of all numbers that are in either A or B. Looking at our choices, the only number that isn't in either A, B, or both is 23.
The symbol
← Didn't Know|Knew It →

The above Venn diagram represents survey respondents from a recent political poll. Based on the respondent's political affiliation, they were classified into group  only,
only,  only or both groups.
What percentage of the respondents were classified into both groups?
The above Venn diagram represents survey respondents from a recent political poll. Based on the respondent's political affiliation, they were classified into group
What percentage of the respondents were classified into both groups?
Tap to reveal answer
The common portion of this Venn diagram represents the percentage of respondents that were classified into both groups. In order to calculate the percentage that represents the amount of respondents classified into both groups, first find the sum of group  and group
  . Then subtract that quantity from
  percent.
The solution is:


The common portion of this Venn diagram represents the percentage of respondents that were classified into both groups. In order to calculate the percentage that represents the amount of respondents classified into both groups, first find the sum of group
The solution is:
← Didn't Know|Knew It →
The above Venn diagram represents survey respondents from a recent political poll. Based on the respondent's political affiliation, they were classified into group only, only or both groups.
What fraction of respondents were classified into only group  ?
?
The above Venn diagram represents survey respondents from a recent political poll. Based on the respondent's political affiliation, they were classified into group
What fraction of respondents were classified into only group
Tap to reveal answer
Since the information provided in the Venn diagram represents percentages, convert the quantity in category  from a percentage to a fraction. To convert a percentage to a fraction, divide the percent by a divisor of
  , then simplify the fraction if applicable; however, in this case the fraction can't be reduced.
The solution is:
Group 
Thus:

Since the information provided in the Venn diagram represents percentages, convert the quantity in category
The solution is:
Group
Thus:
← Didn't Know|Knew It →

The above Venn diagram represents the total number of respondents from a survey administered in  . Respondents were categorized into only group
  , only group
  or both of the groups.
What percentage of respondents were categorized into only group 
The above Venn diagram represents the total number of respondents from a survey administered in
What percentage of respondents were categorized into only group
Tap to reveal answer
To find the missing quantity for category  , first calculate the sum from the common portion of the Venn diagram and category
  . Then, subtract that sum from
  , because the total percentage of respondents must equal
  .
.
The algebraic solution is:


To find the missing quantity for category
The algebraic solution is:
← Didn't Know|Knew It →
The above Venn diagram represents the total number of respondents from a survey administered in . Respondents were categorized into only group , only group or both of the groups.
What fraction of the respondents were categorized into both groups?
The above Venn diagram represents the total number of respondents from a survey administered in
What fraction of the respondents were categorized into both groups?
Tap to reveal answer
Since the information provided in the Venn diagram represents percentages, convert the quantity in the common portion of the diagram from a percentage to a fraction. To convert a percentage to a fraction, divide the percentage by a divisor of , then simplify the fraction if possible.
Common portion is equal to  . Therefore, the solution is:

Since the information provided in the Venn diagram represents percentages, convert the quantity in the common portion of the diagram from a percentage to a fraction. To convert a percentage to a fraction, divide the percentage by a divisor of
Common portion is equal to
← Didn't Know|Knew It →

Ms. Dunn gave her class a survey to find out which states her student's have visited. Ms. Dunn was surprised to find that all of her student's had visited either New York City or Texas, and some of her student's had visited both locations.
The above Venn diagram represents the percentage of students who have visited only NYC, only Texas, and those who have visited both locations.
What percentage of the students have visited both NYC and Texas?
Tap to reveal answer
The common portion of this Venn diagram represents the percentage of respondents that were classified into both groups. In order to calculate the percentage that represents how many students have visted both NYC and Texas, first find the sum of group  and group
  . Then subtract that quantity from
  .
.
The solution is:


The common portion of this Venn diagram represents the percentage of respondents that were classified into both groups. In order to calculate the percentage that represents how many students have visted both NYC and Texas, first find the sum of group
The solution is:
← Didn't Know|Knew It →
Ms. Dunn gave her class a survey to find out which states her student's have visited. Ms. Dunn was surprised to find that all of her student's had visited either New York City or Texas, and some of her student's had visited both locations.
The above Venn diagram represents the percentage of students who have visited only NYC, only Texas, and those who have visited both locations.
What ratio represents the number of students that have gone only to NYC, in comparison to the rest of the class?
Tap to reveal answer
Since  of Ms. Dunn's class have visited only NYC,
  out of every
  students must have only visited NYC. This can be represented by the ratio
  ; however, this ratio does not appear as an answer choice, so we must reduce this ratio by dividing each part by their greatest common divisor.
The solution is:

Since
The solution is:
← Didn't Know|Knew It →

Mr. Robinson surveyed his class to find out what his students planned on doing during their summer vacation. Every student in his class stated that they planned on swimming with their friends and/or travel with their family.
What percentage of Mr. Robinson’s class planned on both swimming with their friends and traveling with their family?
Tap to reveal answer
The common portion of this Venn diagram represents the percentage of Mr. Robinson's students that stated they planned on both swimming and traveling during the summer. In order to calculate the percentage that represents the amount of students classified into both groups, first find the sum of the swimming group and traveling group. Then subtract that sum from  .
.
The solution is:


The common portion of this Venn diagram represents the percentage of Mr. Robinson's students that stated they planned on both swimming and traveling during the summer. In order to calculate the percentage that represents the amount of students classified into both groups, first find the sum of the swimming group and traveling group. Then subtract that sum from
The solution is:
← Didn't Know|Knew It →

Kelly and Antonio are in a group together on a popular social media website. They realized that within the group they have mutual friendships as well as friendships exclusive of one another.
What ratio accurately represents the amount of friendships within the group that they have in common to those that they do not have in common?
Tap to reveal answer
In order to find the ratio of friends that Kelly and Antonio have in common compared to the group members who are only friends with one or the other first find the percentage value of the common portion of the Venn diagram. To calculate this value, find the sum of the two exclusive groups and then subtract that sum from  .
.


This means that  of the group members are common friends of Kelly and Antonio. To convert this percentage to a ratio, first write
  as a fraction, and then simplify as a ratio.
 is equal to:
This means that  out of every
  group members are mutual friends of Kelly and Antonio.
In order to find the ratio of friends that Kelly and Antonio have in common compared to the group members who are only friends with one or the other first find the percentage value of the common portion of the Venn diagram. To calculate this value, find the sum of the two exclusive groups and then subtract that sum from
This means that
This means that
← Didn't Know|Knew It →
Kelly and Antonio are in a group together on a popular social media website. They realized that within the group they have mutual friendships as well as friendships exclusive of one another.
What ratio accurately represents the amount of friendships within the group that they do not have in common to those that they do have in common.
Tap to reveal answer
To find the ratio of Kelly and Antonio's exclusive friendships to their mutual friendships--find the sum of the two exclusive groups in the Venn diagram:

This means that  of the members in the group are not friends with both Kelly and Antonio. To convert this percent to a ratio, first write
  as a fraction, and then simplify as a ratio.
 is equal to:
This means that  out of every
  group members are not mutual friends of Kelly and Antonio.
To find the ratio of Kelly and Antonio's exclusive friendships to their mutual friendships--find the sum of the two exclusive groups in the Venn diagram:
This means that
This means that
← Didn't Know|Knew It →

Kayla used a popular social media website to survey her friends' hobbies. All of her friends either play sports or enjoy playing video games, and some of her friends do both.
What fraction of her friends only play sports?
Kayla used a popular social media website to survey her friends' hobbies. All of her friends either play sports or enjoy playing video games, and some of her friends do both.
What fraction of her friends only play sports?
Tap to reveal answer
In order to calculate the fraction of Kayla's friends who only play sport, first find the sum of the common portion and video game portion of the Venn diagram. Then subtract that sum from  whole.
The solution is:

Note: 
Thus, 
This means that half of Kayla's friends only play sports.
In order to calculate the fraction of Kayla's friends who only play sport, first find the sum of the common portion and video game portion of the Venn diagram. Then subtract that sum from
The solution is:
Note:
Thus,
This means that half of Kayla's friends only play sports.
← Didn't Know|Knew It →
Kayla used a popular social media website to survey her friends' hobbies. All of her friends either play sports or enjoy playing video games, and some of her friends do both.
What percentage of Kayla's friends play sports and video games?
Kayla used a popular social media website to survey her friends' hobbies. All of her friends either play sports or enjoy playing video games, and some of her friends do both.
What percentage of Kayla's friends play sports and video games?
Tap to reveal answer
In order to solve this problem, identify that the common portion of this Venn diagram represents Kayla's friends who play sports and video games. Since  of her friends play sports and video games, convert this fraction to a percent.
The solution is:

Note: the most efficient way to convert this fraction to a percent is to find an equivalent fraction to  with a denominator of
  .
.
In order to solve this problem, identify that the common portion of this Venn diagram represents Kayla's friends who play sports and video games. Since
The solution is:
Note: the most efficient way to convert this fraction to a percent is to find an equivalent fraction to
← Didn't Know|Knew It →

Results from a recent political poll are represented by the Venn diagram above. The results indicate the percentage of voters who have only voted for Democratic presidential candidates, only Republican presidential candidates, and those that have voted for both Democratic and Republican candidates in the past.
What percentage of respondents have voted for both Democratic and Republican presidential candidates?
Tap to reveal answer
To solve this problem first find the sum of the two exclusive groups shown in the Venn diagram:

This means that  of respondents have exclusively voted for presidential candidates from only one political party.
To find the value of the common portion of the Venn diagram, calculate the difference between  and
and  :
:

This means that  of the respondents have voted for both Democratic and Republican presidential candidates.
To solve this problem first find the sum of the two exclusive groups shown in the Venn diagram:
This means that
To find the value of the common portion of the Venn diagram, calculate the difference between
This means that
← Didn't Know|Knew It →
See the above Venn diagram. Which of the following sets is represented by the gray region?
See the above Venn diagram. Which of the following sets is represented by the gray region?
Tap to reveal answer
The shaded area represents the set of all elements that are both in and not in . This the intersection of and the complement of , or .
The shaded area represents the set of all elements that are both in
← Didn't Know|Knew It →
See the above Venn diagram. Which of the following sets is represented by the gray region?
See the above Venn diagram. Which of the following sets is represented by the gray region?
Tap to reveal answer
The gray region represents all elements that either are in , are not in - that is, are in - or both. This is the union of and , or .
The gray region represents all elements that either are in
← Didn't Know|Knew It →
Let set , the set of all natural numbers.
= { | is a multiple of 6 }
= { | is a multiple of 9 }
Which of the following numbers would appear in the gray region of the Venn diagram?
Let set
Which of the following numbers would appear in the gray region of the Venn diagram?
Tap to reveal answer
The gray area represents the portion of that is not in - in other words, all multiples of 9 that are not also multiples of 6.
Therefore, 4,572, 3,438, and 8,544 can be eliminated.
, so 9,349 can be eliminated because it isn't a multiple of 9.
and , so, as both a nonmultiple of 6 and a multiple of 9, 4.077 is the correct choice.
The gray area represents the portion of
Therefore, 4,572, 3,438, and 8,544 can be eliminated.
← Didn't Know|Knew It →
Given the Venn diagram below, which of the following does not belong to ?
Given the Venn diagram below, which of the following does not belong to
Tap to reveal answer
The symbol stands for the union between two sets. Therefore, means the set of all numbers that are in either A or B. Looking at our choices, the only number that isn't in either A, B, or both is 23.
The symbol
← Didn't Know|Knew It →