0%
0 / 3 answered
How to find the common part with a Venn Diagram Practice Test
•3 QuestionsQuestion
1 / 3
Q1
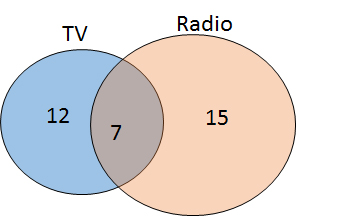
Students were asked if they prefer TV or radio. The following Venn Diagram depicts the number of students who said TV, radio, or both. How many students like both TV and radio?
Students were asked if they prefer TV or radio. The following Venn Diagram depicts the number of students who said TV, radio, or both. How many students like both TV and radio?